

Over the past week, Althea and I started our summer heat study. This project aims to understand how local communities experience heat, and how heat-related issues are viewed and coped with during daily routines.
Being in the heart of the desert, heat vulnerability is a huge issue in Phoenix. Existing approaches have applied GIS modeling, climate data analysis, remote sensing, heat-related hospitalization rates to identify heat vulnerability regions and communities. This map of Phoenix is particularly interesting, as it defines heat vulnerability in terms of a number of complex factors: exposure, sensitivity, and community coping capacity.
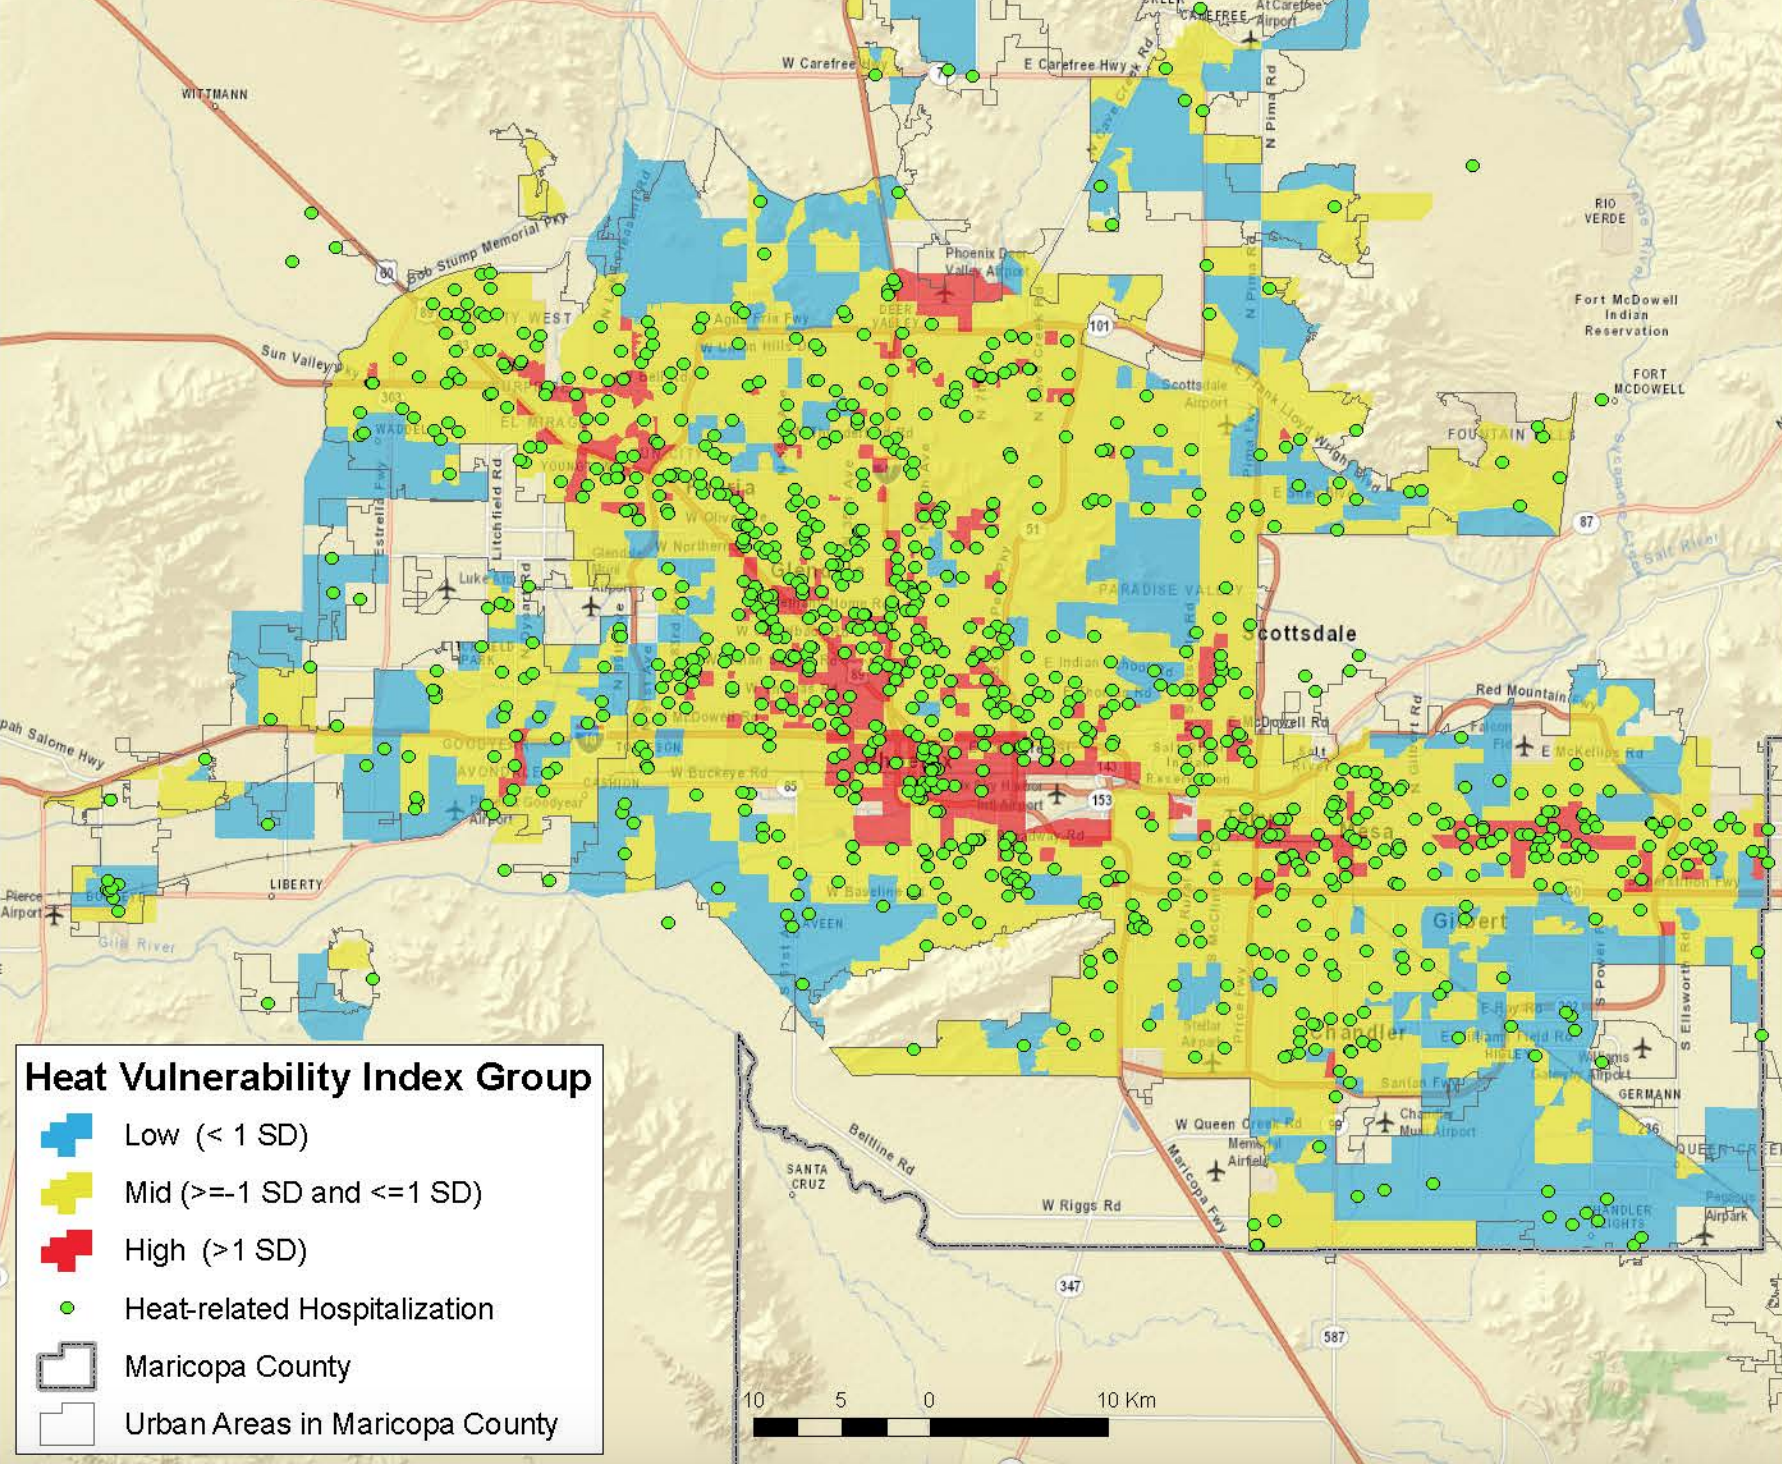 Map from Declet-Barreto, et al. 2013.
Complimentary to top-down data analysis, our study relies on qualitative, participatory methods, similar to other projects that identified social determinants of urban health disparities. Photovoice has been of particular inspiration for our work: this project asked urban youths in high-risk neighborhoods to photograph and document elements in their environment that influence their health.
Our work aims to understand and express the human experience of heat. Broadly, we want to know:
- How are human lives and activities effected by heat?
- How can the experience of living in extreme heat be communicated across different socio-economic regions and to broader audiences outside of Phoenix?
- What are the material and social workarounds around heat-related challenges?
To answer these questions, we are running a longitudinal diary study that asks people to document their heat-related experiences over the course of the summer.
We are asking participants to keep a journal that documents their views, experiences, and workarounds with heat-related challenges several times a week. We are also collecting photographs of heat-related experiences and asking participants to send us weekly postcards that describe a heat-related experience that stood out each week. Finally, communities are also provided with thermal cameras to identify high-heat areas in their environments.
We are using the Flir and the Seek smart phone add-ons to capture thermal imagery. Gino Ceresia helped us test these cameras. A few test images:
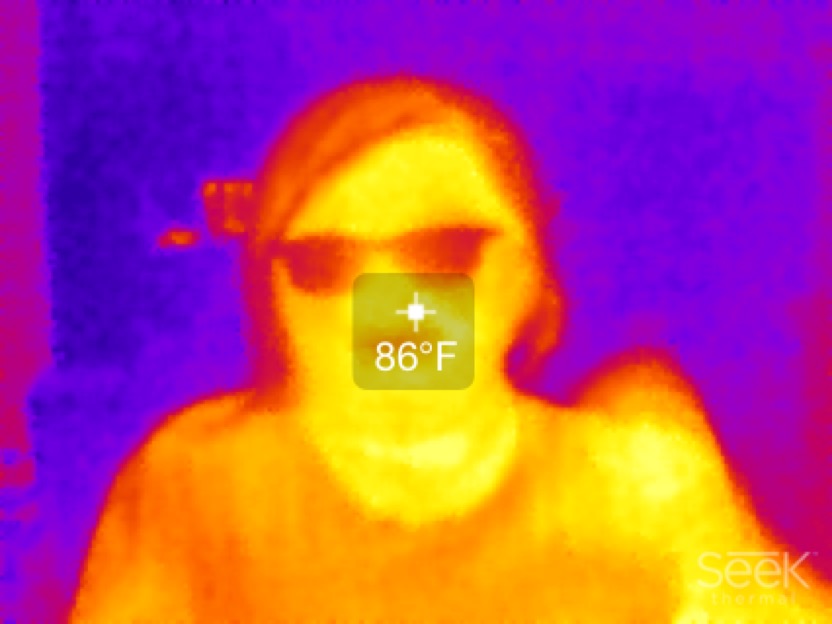
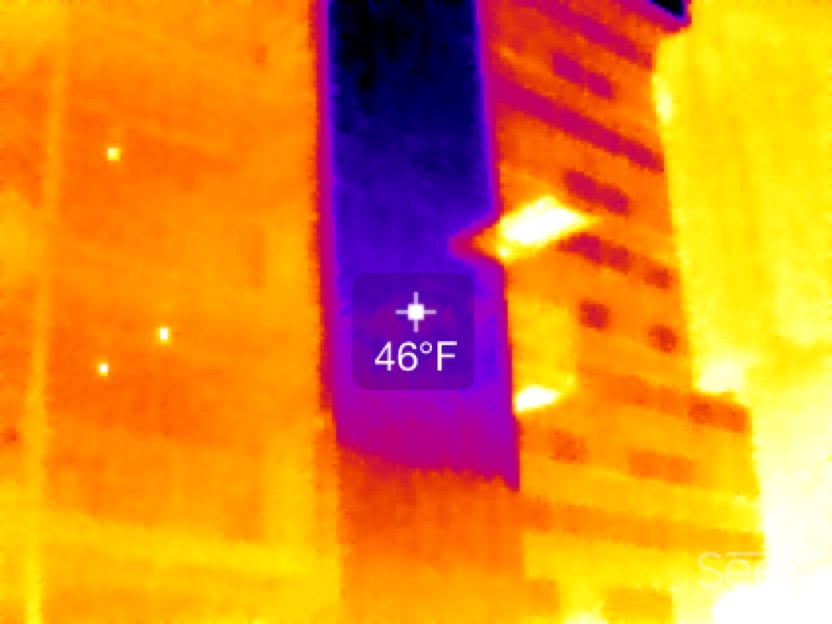
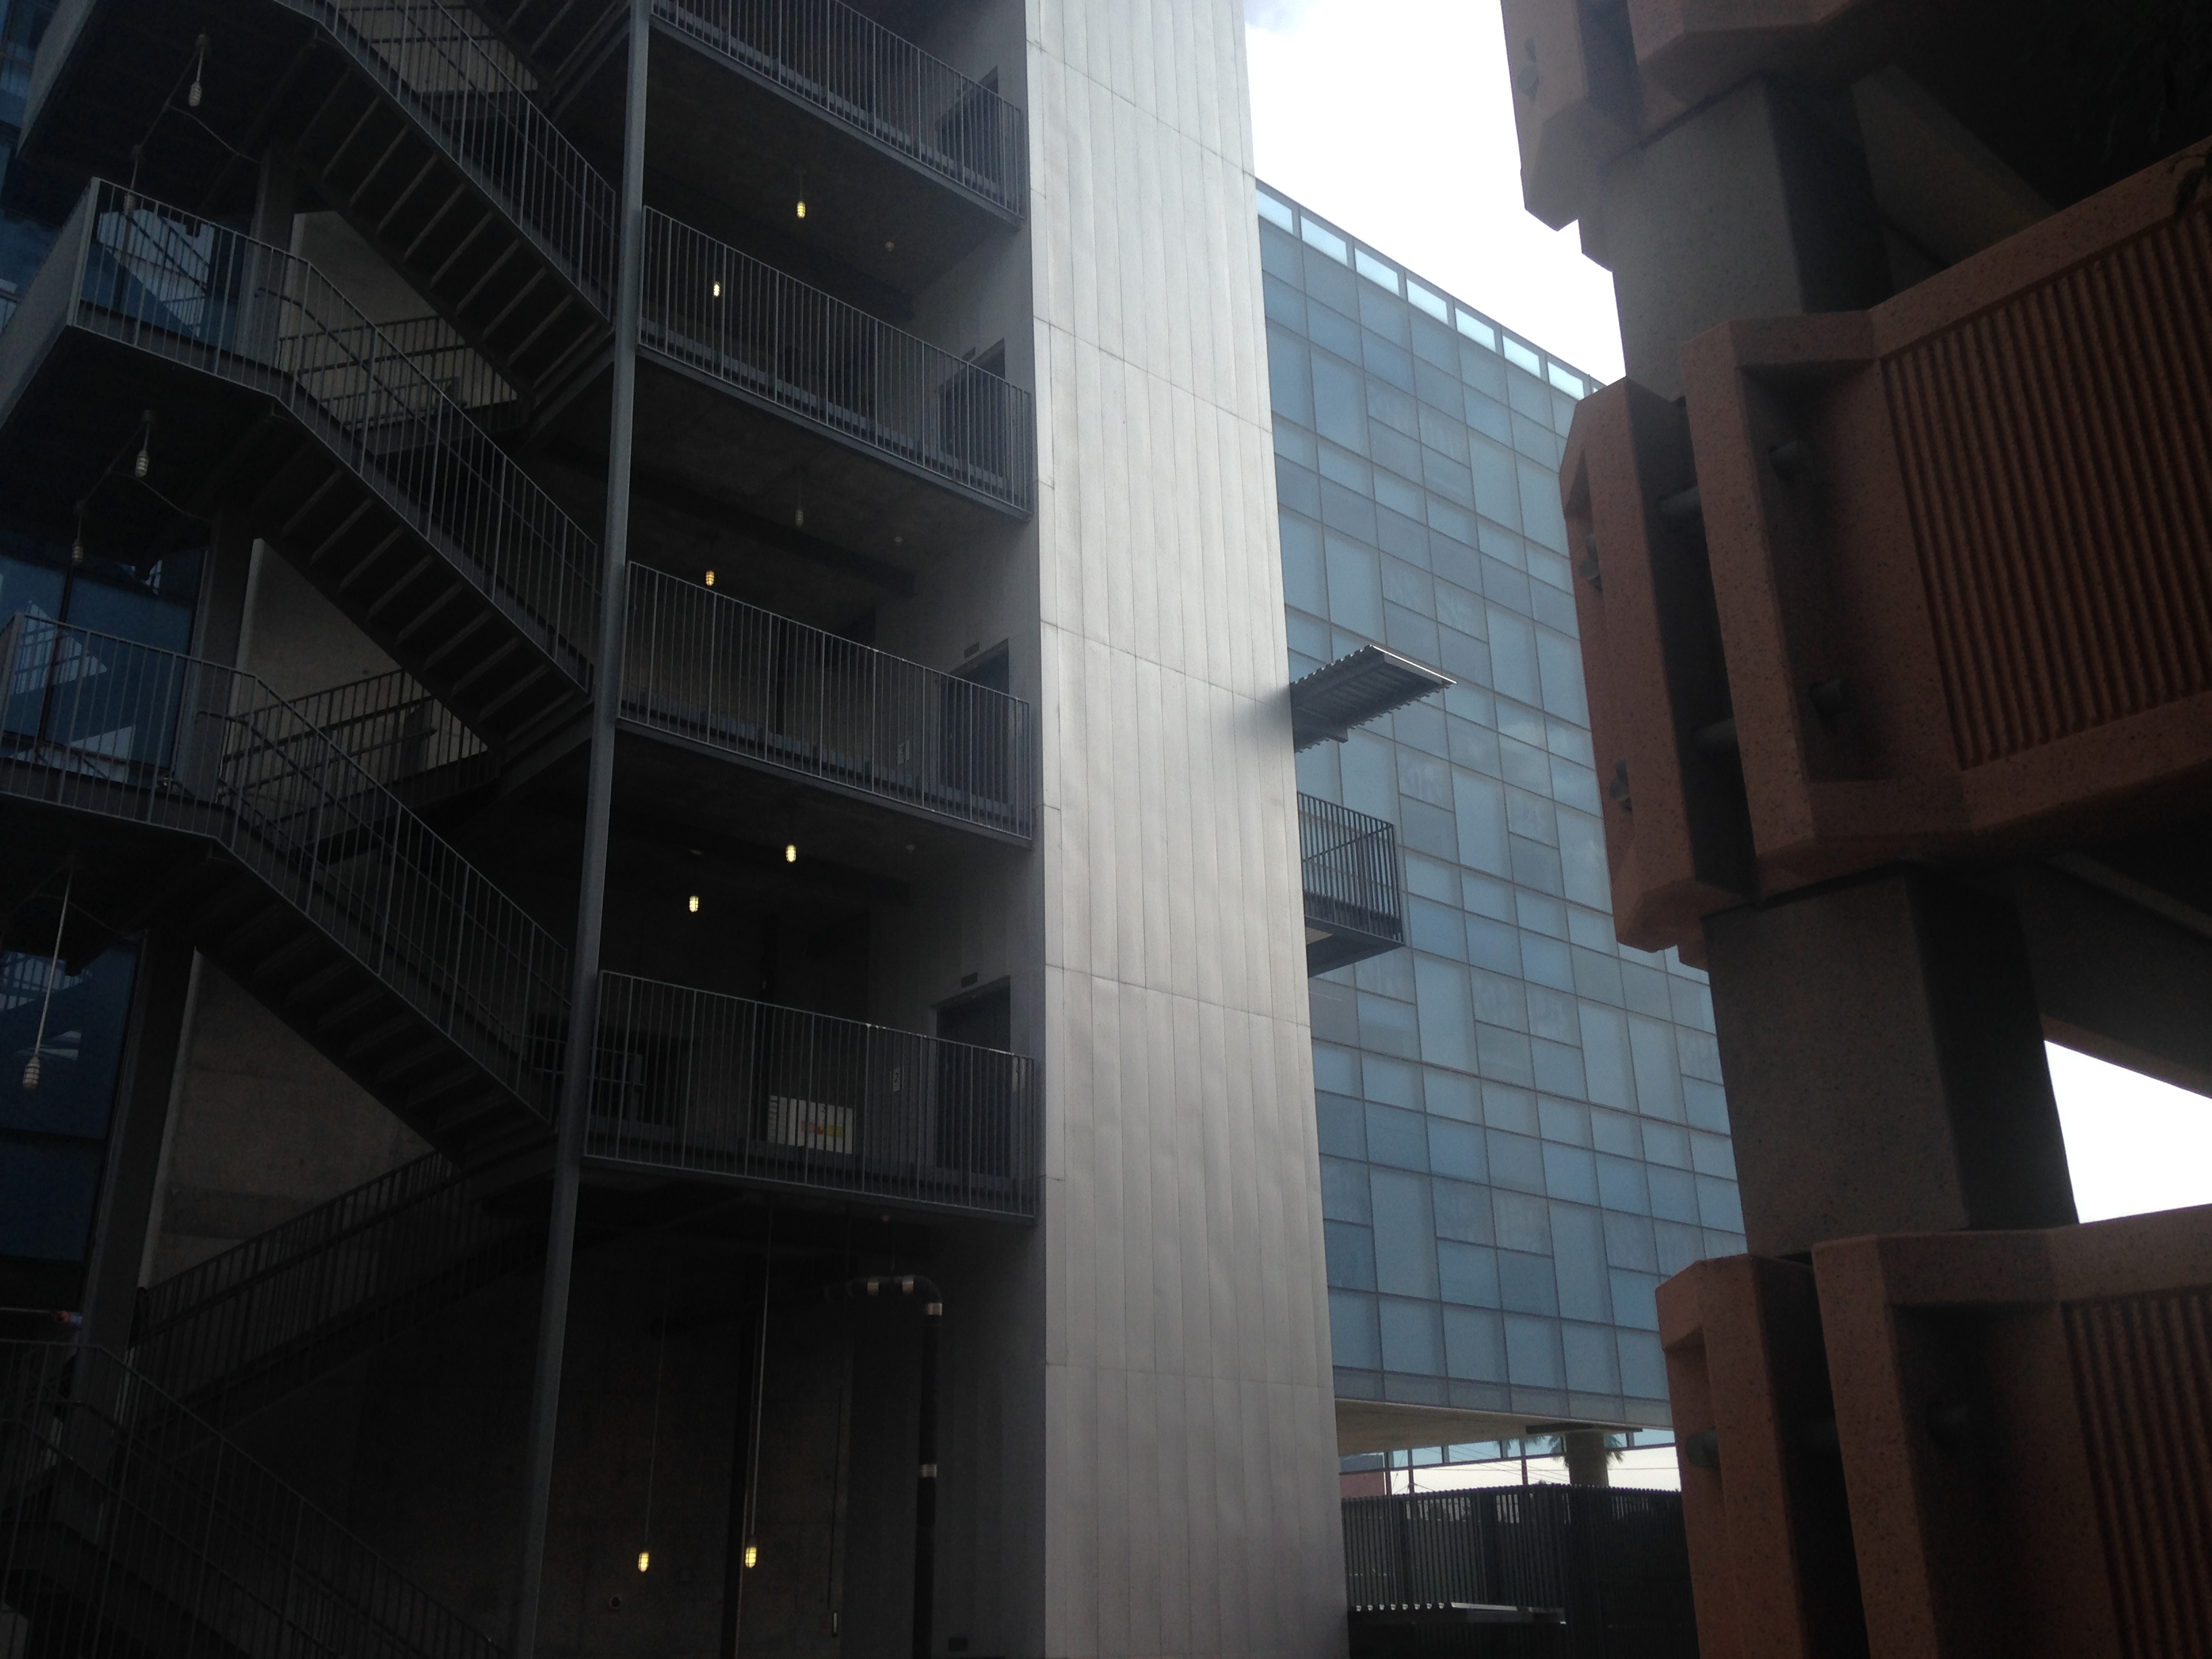 This picture was taken from the back of our Stauffer B lab, and it shows the temperature difference between the sides of the building that are covered in glass and the sides that are covered in metal. The cool part is the metal.
We hope to share some of the photographs and diary entries from this work in a public exhibit. Drawing on the collected data, the project will express a more grounded account of heat vulnerability in Phoenix, giving a richer voice to those who experience it the most.
-Stacey

Reblogged this on althea e pergakis and commented:
I’m working on a heat study this summer!
LikeLike